AI water use in context: comparing the 500 ml claim to coffee, beef, and cotton
The 500 ml-per-prompt claim about generative AI, compared honestly to the water footprint of coffee, beef, cotton, and rice. The aggregate is small. The local concentration is the real story. What CIOs should defend when sustainability committees raise this.
Holding·reviewed27 May 2026·next-37d
The dominant water statistic about generative AI, that ChatGPT consumes a 500 ml bottle for every 10 to 50 prompts, comes from a single 2023 paper by Pengfei Li, Jianyi Yang, Mohammad A. Islam, and Shaolei Ren at UC Riverside and UT Arlington. The paper is careful about what the number means. The discourse around it generally is not.
When the statistic enters a board conversation, a sustainability committee, or a CIO one-to-one, it tends to do so as a standalone fact. The question that almost never gets asked alongside it: how much water does a hamburger consume? Or a cotton t-shirt? Or a kilogram of rice? Without those reference points, the AI number is not a fact. It is a feeling.
This piece does two things. It puts the 500 ml figure next to the Water Footprint Network’s published figures for common household and consumer goods, so the comparison is visible. It then separates the part of the AI-water concern that the comparison defuses (aggregate scale) from the part it does not (local concentration in water-stressed regions), so neither the panic nor the dismissal goes unchallenged.
Where the 500 ml number comes from
The Li et al. 2023 paper “Making AI Less Thirsty” is the source. The paper models water consumption for training and inference of GPT-3-class models in Microsoft data centers, and reports two distinct components: on-site water (used directly for evaporative cooling at the data center) and off-site water (used at the power plants generating the electricity the data center consumes). The off-site component typically dominates, because thermoelectric power generation is itself a heavy water consumer, and the share depends on the regional electricity mix.
The headline 500 ml-per-10-to-50-queries figure is a midpoint that varies by roughly 5x across geographies and time-of-day. A query routed to a data center in a cool, hydro-powered region consumes a fraction of the water of the same query routed to a hot, gas-powered region at peak load. The paper is explicit that the number is a modelled estimate, not a measurement of any specific ChatGPT prompt.
A conservative working reading: assume the worst-case end of the range and call it 50 ml per query. A heavy individual user running 50 queries per day, 365 days per year, consumes roughly 18,250 queries times 50 ml, which is about 913 litres per year. A more typical heavy-professional pattern of 25 queries per day, 250 working days per year, lands at about 313 litres per year. The defensible band for a single heavy user is roughly 300 to 900 litres per year. That is the number to put on the comparison table.
The comparison
The Water Footprint Network maintains the most-cited dataset on the water footprint of agricultural and consumer products, built on the methodology established by Mekonnen and Hoekstra (2010, 2012). The published global-average figures, all in litres of water per kilogram of product or per unit, look like this:
| Product | Water footprint |
|---|---|
| 1 kg beef | 15,415 litres |
| 1 kg pork | 5,988 litres |
| 1 kg chicken | 4,325 litres |
| 1 kg cheese | 5,060 litres |
| 1 kg rice (white) | 2,497 litres |
| 1 kg soybeans | 2,145 litres |
| 1 kg wheat | 1,827 litres |
| 1 cotton t-shirt (250 g) | 2,495 litres |
| 1 pair of cotton jeans | about 7,500 to 10,000 litres |
| 1 cup of coffee (125 ml) | 140 litres |
| 1 cup of tea (250 ml) | 30 litres |
| 1 almond | about 12 litres |
| 1 hamburger (150 g beef) | about 2,300 litres |
| 1 heavy ChatGPT user, full year | about 300 to 900 litres |
All food, beverage, and textile figures are from Mekonnen and Hoekstra’s water-footprint dataset maintained by the Water Footprint Network (Value of Water Research Report Series, particularly Reports 47 and 48 on crop and animal product water footprints); the almond figure is from published UC Davis water-footprint research on California specialty crops.
A few equivalences that make the comparison concrete. A year of heavy ChatGPT use, on the high end of the band, consumes roughly the water footprint of one quarter-pound hamburger plus a side of nothing. A single cotton t-shirt is roughly three to eight years of heavy ChatGPT use. A single pair of jeans is roughly eight to thirty years. A single kilogram of beef is roughly seventeen to fifty years. A reader who drinks one cup of coffee per day consumes about 51,100 litres of water per year in coffee alone, which is roughly fifty-six to one hundred and seventy years of heavy ChatGPT use.
These ratios are not the result of cherry-picked extremes. They are the median figures from the most-cited global water-footprint dataset, against the most-cited AI-water estimate.
What the comparison reveals
The aggregate global picture is consistent with the per-unit comparison. The UNESCO World Water Development Report 2024 and the FAO AQUASTAT database put global freshwater withdrawals at roughly 4,000 cubic kilometres per year, of which agriculture accounts for about 70%, industry about 20%, and municipal and domestic use the remaining 10%. The US Geological Survey’s most recent national assessment puts US freshwater withdrawals at 322 billion gallons per day, with thermoelectric power and irrigation together accounting for about 70%.
Against that baseline, the global data center industry sits well inside the industrial slice. Even with Google’s 2025 Environmental Report disclosure of 8.1 billion gallons of water consumption in calendar year 2024, the Microsoft 2024 Environmental Sustainability Report disclosure of about 7.8 million cubic metres globally, and the rest of the hyperscaler footprint added in, the global data center sector consumes a small single-digit fraction of one percent of global freshwater withdrawals. The AI share of that data center footprint is a fraction of a fraction.
The reading that follows: if the question facing the enterprise is whether the aggregate water footprint of AI is on the same order of magnitude as the food, textile, or beverage footprints already accepted as normal, the answer is no. It is several orders of magnitude smaller.
What the comparison hides
The aggregate-is-small reading is correct on its own terms and incomplete on others. Two things it does not address.
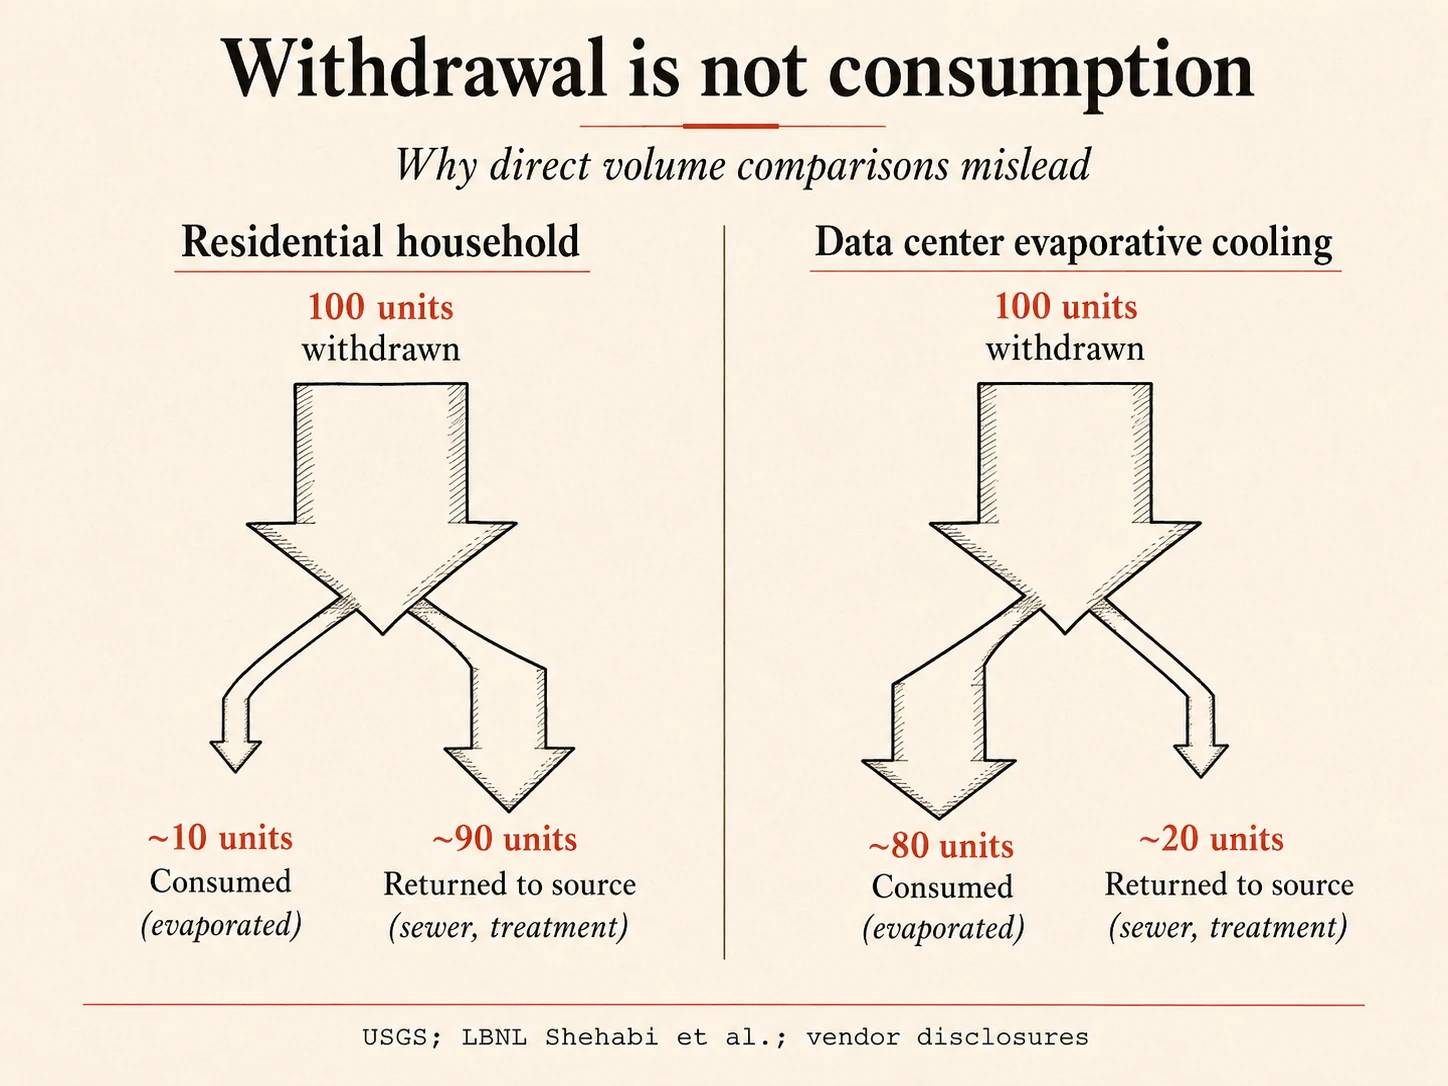
The first is the distinction between water withdrawal and water consumption. A residential household withdraws large volumes and consumes a small fraction; most of the rest returns to the source through sewers and wastewater treatment. Evaporative data center cooling withdraws and consumes; roughly 80% of the water entering an evaporative tower exits as vapour and does not return locally. A direct-to-volume comparison between residential and data center water that ignores the consumption ratio understates the data center impact by a factor of several. The water-footprint-per-kilogram figures cited above are consumption-based figures (the green-plus-blue water footprint), so the comparison to AI consumption is apples-to-apples in this respect, but a comparison to raw residential withdrawal would not be.
The second is geographic concentration. The aggregate global number tells you almost nothing about the local water stress imposed by any specific facility. The most-discussed concrete example: Microsoft’s West Des Moines, Iowa data center used approximately 11.5 million US gallons of water in July 2022, during a period that included GPT-4 training, which was about 6% of the city’s water consumption that month according to Associated Press reporting from 9 Sep 2023. That is a real and locally significant load, in a city that does not get to spread its water-supply problem across the rest of the global agricultural footprint. The same pattern repeats at facilities in Querétaro, Mexico; The Dalles, Oregon; and parts of Arizona, Chile, and Spain.
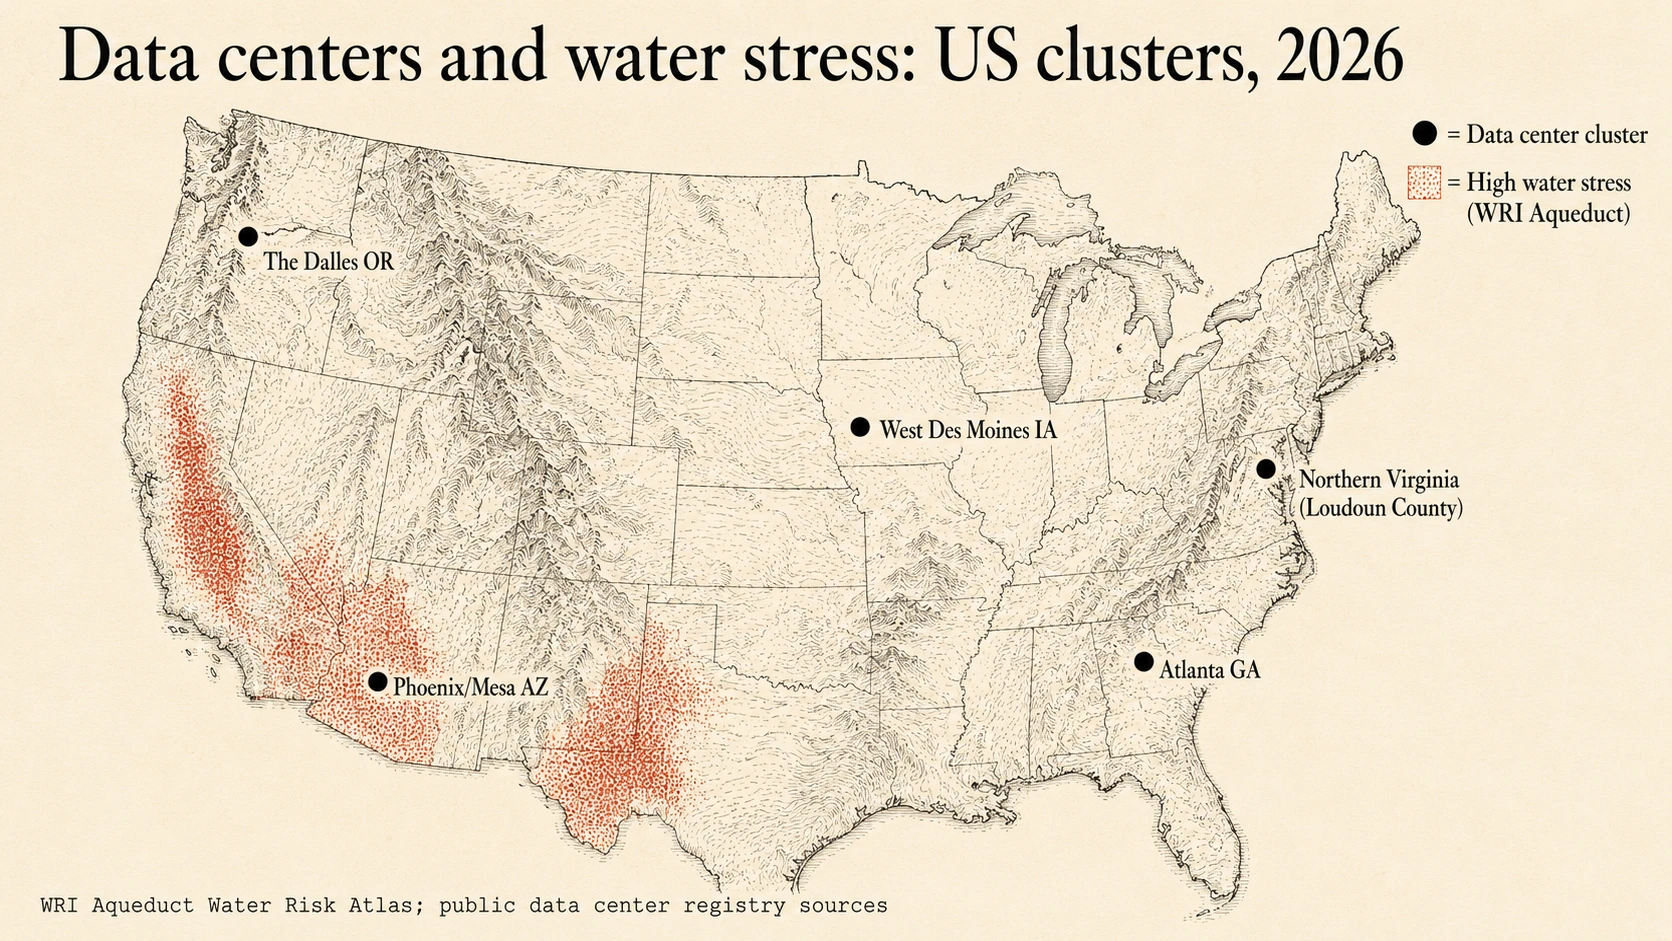
Microsoft’s own 2024 Environmental Sustainability Report acknowledges that 42% of its water consumption comes from areas with water stress. Google’s 2025 Environmental Report puts roughly 15% of its freshwater withdrawals in high-water-scarcity regions. These are vendor-side disclosures, not activist claims. The local-concentration problem is real, getting larger as new facilities are sited in regions with cheap power and limited water, and is the part of the AI-water concern that deserves governance attention.
The aggregate context defuses the question “is AI consuming a meaningful share of global water”. The local concentration sustains the separate, narrower question “is this specific facility consuming a meaningful share of this specific watershed”. Both are legitimate. They have different answers and require different responses.
What CIOs should defend
When the AI-water question lands on a CIO desk, it usually arrives through one of three channels: a board sustainability discussion, a CSRD or SEC-disclosure preparation cycle, or a procurement objection from a sustainability officer reviewing a hyperscaler contract. The defensible position in all three is the same.
First, state the comparison plainly. A year of heavy enterprise ChatGPT use, on the high end of estimates, consumes less water than the catering for a single team offsite. The water footprint of the enterprise’s coffee budget, the t-shirts in its swag inventory, or the meat in its cafeteria almost certainly exceeds the water footprint of its AI usage by one to three orders of magnitude. This is not an argument that AI water use does not matter; it is an argument that the enterprise’s sustainability prioritisation should reflect the actual shape of its footprint.
Second, separate the aggregate footprint question from the locational question. Ask the vendor for the four-question disclosure set named in the FAQ above: WUE per data center, water-stress-region percentage, scope of water reporting, and contractual commitment to a ceiling on both. Vendors that have done the work can answer; vendors that have not, cannot. The disclosure is the lever, not the absolute number.
Third, write the EU Corporate Sustainability Reporting Directive (CSRD) double-materiality assessment to reflect both. The aggregate water footprint of the enterprise’s AI use is unlikely to clear a CSRD materiality threshold on its own. The locational concentration of water use by a hyperscaler in a water-stressed region, if material to that watershed, may. The double-materiality framing handles this honestly without requiring the enterprise to choose a side.
The honest both-and reading is defensible to a board, a regulator, and a sustainability committee. The pure-debunk reading collapses under questions about West Des Moines. The pure-panic reading collapses under questions about a hamburger. Both extremes lose to the comparison.
On the record
This piece’s primary claim, on the Holding-up ledger as AM-173:
The aggregate water footprint of generative AI is small relative to common consumer products; the real governance concern is geographic concentration in water-stressed regions, not global query volume.
Reviewed on a 90-day cadence. The trigger conditions that would move the claim to Partial or Not holding are listed in the claim YAML and reproduced on the ledger entry. The procurement-side companion, data-centre water consumption as a vendor-disclosure variable, covers what to require from vendors on water-efficiency posture and water-stress-region exposure.
Cite this article
Pick a citation format. Click to copy.
Spotted an error? See corrections policy →
Reasoned disagreement is a first-class signal here. Every review cycle weighs documented dissent; material dissent becomes part of the article's change history. This is not a corrections form — use /corrections/ for factual errors.
Enterprise AI cost and ROI →
Verifying, tracking, and challenging the ROI claims vendors and analysts make about enterprise agentic AI. 30 other pieces in this pillar.